Your Strategic Partner for
Unlocking China's Sourcing Potential
Economic Order Quantity (EOQ)
Maintaining the inventory and supply chain is a hell of a rigid system. As a seller, you have to fight with:
- Warehousing
- Logistics
- Order fulfillment
- Holding costs
- Inventory stockouts
- Incurring costs on the inventory storage for a long time.
All such cases depress the sellers and ask them to develop the proper plan.
Good news! We have an Economic Order Quantity.
It helps predict future costs and elevates trust in the overall inventory. Sellers can order the optimal number of products and resell them. Are you ready to devise new success pathways and enjoy a flawless business opportunity?
Listen up! Today, we will discuss the EOQ and dig deep into the factors that influence economic order quantity.
Chapter 1: EOQ Basic Idea
What is Economic Order Quantity (EOQ)?
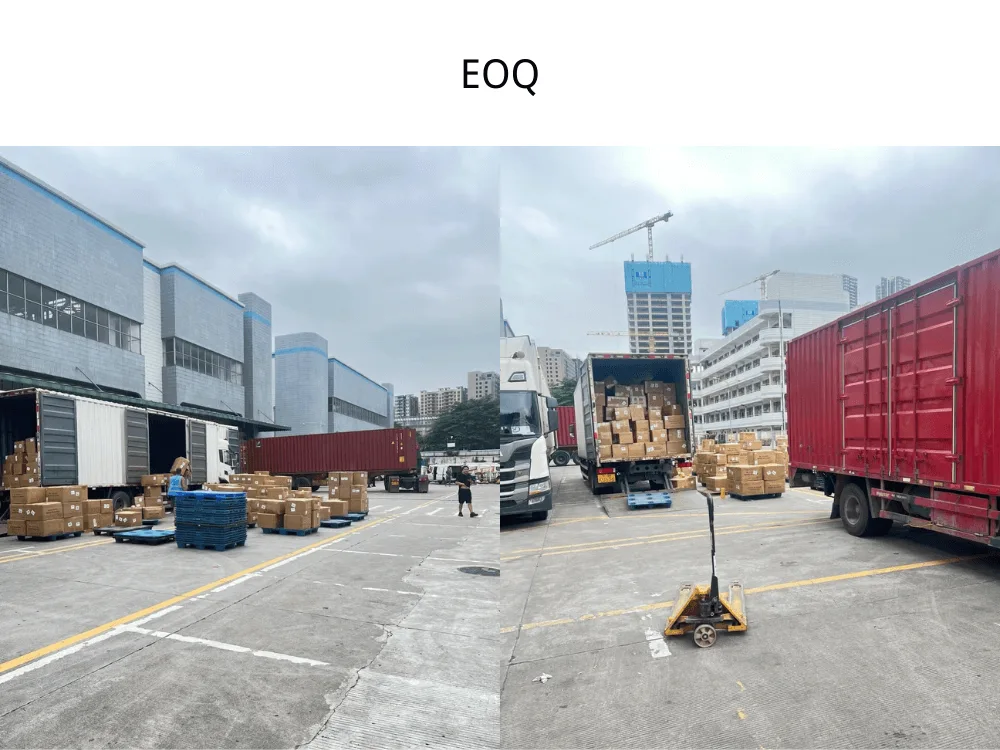
Economic Order Quantity refers to the optimal number of products companies require to refill the stocks. It calculates the data for the number of products to order. The calculation aims to optimize the inventory stocks for the whole supply chain system.
Why is EOQ so important?
Various things help us understand why EOQ can be a game-changing case. These include:
- Cost optimization. Sellers order only a limited number of products required. It helps them save on extra costs.
- Inventory optimization. Optimal stocks help suffice consumers’ needs. So, customer satisfaction is near.
- Better efficiency. Optimal orders with streamlined shipping maintain the flow of inventory better.
Chapter 2: Why Should You Calculate the EOQ?
If you are thinking of the EOQ, it is the best idea ever if implemented correctly. There are a few reasons why you should consider the EOQ.
Cost optimization
Cost optimization is one of the most significant benefits of the EOQ calculation. It saves the cost in multiple ways. For example:
- Sellers order limited items. It shrinks the inventory prices and helps manage business better.
- Inventory storage costs decrease exponentially. That is why sellers save more costs.
Such cost optimization allows better business over there.
Improved inventory turnover
Since you are managing the inventory with the right approach, it is no longer a big deal to devise a plan to manage your products. You order the required number of items that quickly sell.
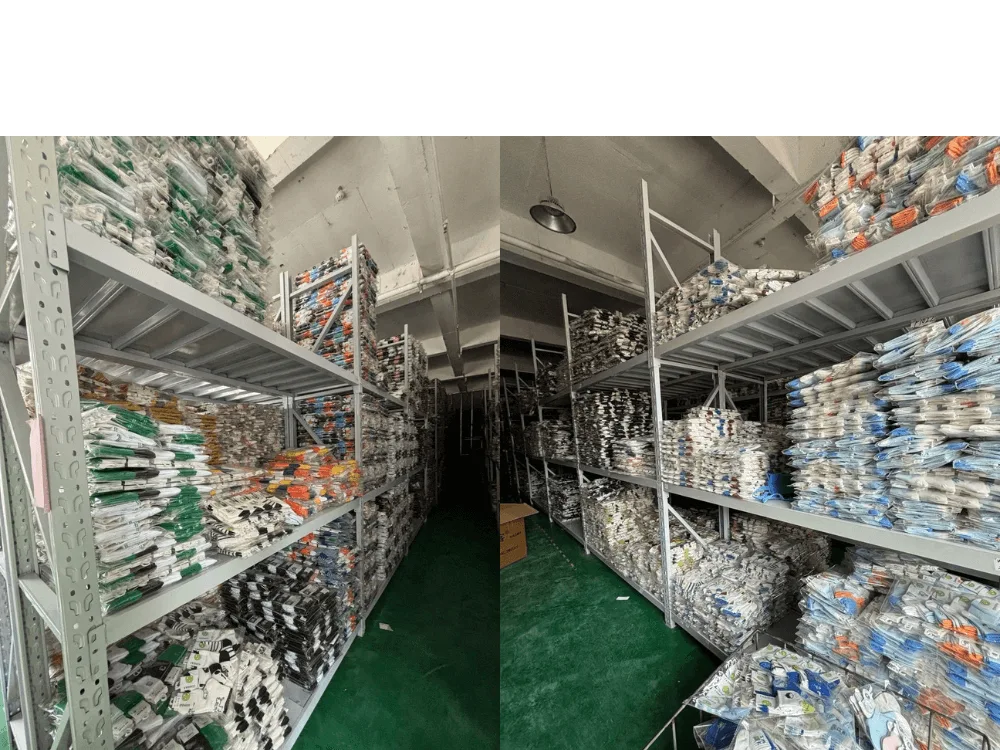
Such an approach optimizes the inventory levels. Helps replenish the orders on time. And enjoy better inventory efficiency.
Reduction of stockouts and overstock situations
Stockouts or overstock are toxic things for a business. This is mainly eliminated with the EOQ formula. Sellers get the calculated number of stocks that sell. There is no overstocking, leading to elevated inventory expenses or stockout situations and decreased consumer satisfaction.
Enhancing overall supply chain efficiency
Supply Chain relies on product sales and shipping. What if you sell and ship products on time? That leads to an elevated flow of inventory through the whole supply chain.
Guess the results? You’ll get better inventory management. Overall, supply chain efficiency will skyrocket with this approach.
Quantity discounts
There comes a season when the product demands are high. In that case, sellers find the sweet spots to order inventory in bulk and enjoy the volume discounts.
Sometimes, calculation tells the high number of products. In that case, sellers also order more products and enjoy discounts.
Chapter 3: Factors Affecting EOQ
Various cost types affect the EOQ. You can recognize the following types.
Holding costs
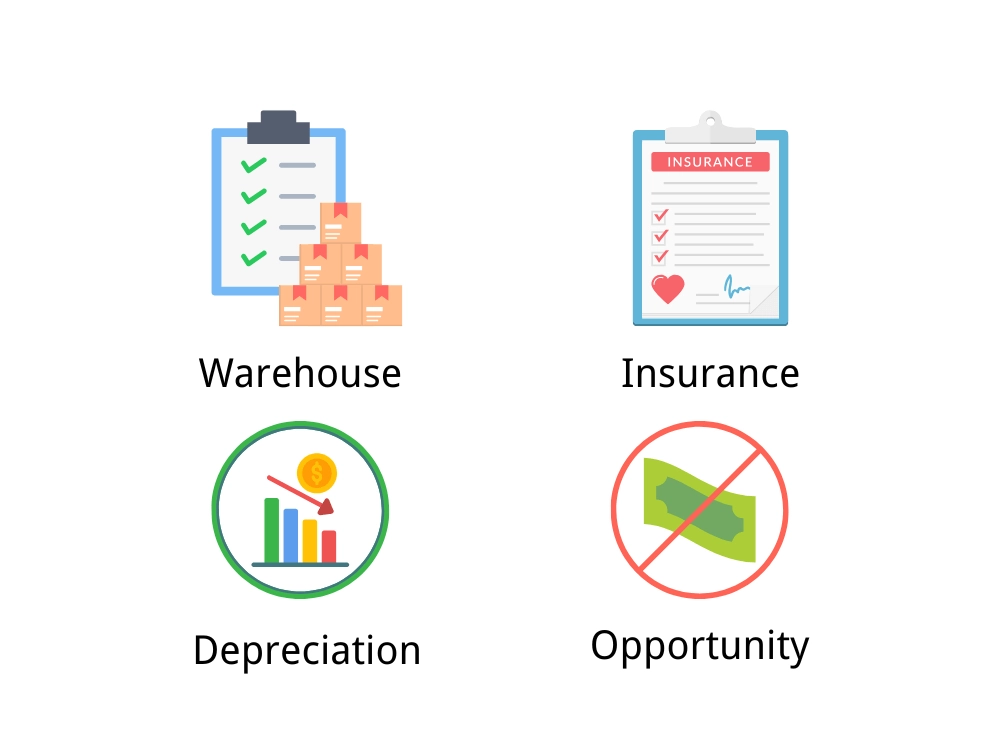
Holding costs refers to the overall expenses of inventory management. It deals with inventory storage, insurance, and depreciation, including handling costs.
Higher holding costs can affect EOQ and urge sellers to make fewer orders and save more money.
Ordering costs
Ordering costs are the set of prices including the ordering and processing. It calculates the overall prices, including the handling during transit and shipping.
Elevated ordering costs cause the EOQ to minimize the number of products ordered and adjust it in the given budget.
Demand rate
The demand rate is the interest of consumers and the period in which inventory sells. A higher demand rate causes EOQ to order more products. At the same time, a slow demand is poisonous and causes EOQ to decrease its costs.
Lead time
Lead time is the overall time required to produce the products. It is the time from receiving orders till the production.
Longer lead times let EOQ forecast more products to avoid stockouts.
Stockout costs
How many consumers were going to order? How many are on the waiting list? All such cases talk about the stockout costs. Sellers can handle the stockouts and order products to meet their inventory stock requirements.
Chapter 4: The EOQ Formula Explained
Basic EOQ formula
Understanding the EOQ can untangle the mystery. The calculation is super easy. Take a look at the formula:
EOQ= (2DS)/H
Breakdown of formula components
Let’s break down each component of the formula.
Annual demand
D in the formula represents the annual demands. It refers to the overall products needed annually. If the yearly demands are high, EOQ can be higher.
Ordering cost
The costs involved in product ordering range from the logistics to handling fees. If the order costs are higher, EOQ jumps up and urges bulk orders to be made with reduced numbers.
Holding cost
The cost of maintaining inventory comes under the holding costs. It comes with:
- Warehousing prices
- Insurance costs
- Depreciation if any
Step-by-step guide to calculating EOQ
The calculation of the EOQ is quite simple.
- Step 1: Research and know the annual demands, ordering costs, and holding costs.
- Step 2: Assess the costs and input the data into the formula.
- Step 3: Calculate the EOQ values and make your next step accordingly.
EOQ formula variations (e.g., production quantity model)
Three types of models are variants of the EOQ. These include:
- Production Quantity Model (EPQ). Are you producing and selling inventory under your manufacturing plants? You can use the EOQ model to calculate the consumption and production rate for all the inventory production.
- Quantity discount model. It helps make bulk orders and saves inventory prices with their ordering costs.
- The Backorder modeladjusts the EOQ. It is applicable when the delayed delivery has to meet the overall demands.
Chapter 5. Holding Costs in Detail
Definition of holding cost
Holding costs is the sum of all prices required to manage the inventory. From warehouse to insurance, it comes with all prices.
Components of holding cost
- Warehousing costs. Finding the warehouses and paying for the costs. These include rent, utilities, and staff for managing products.
- Insurance costsare costs involved in protecting inventory against theft, loss, or damage.
- Depreciationrefers to the loss in value over time if the product loses quality or gets spoiled, especially food items.
- Opportunity Costis the potential profit loss in maintaining the inventory. Sellers could have fetched profits from other businesses.
How to calculate holding cost
Calculate the holding costs with the following:
Holding Cost = (Storage Costs + Employee Salaries + Opportunity Costs + Depreciation Costs) / Total Value of Annual Inventory
Calculate each cost and then apply it to the formula.
Importance of accurate holding cost estimation
Understanding the accurate holding costs is beneficial as:
- Sellers can determine how much of their budget they have.
- It can specify products to order.
- Cost and inventory optimization is quite imminent.
- There is no longer an overordering of the products.
Chapter 6. Ordering Costs Explained
Definition of ordering cost
Ordering cost is the price invested in finding the suppliers and making orders. All costs come under the ordering cost category, from ordering to reception and inspection.
Components of ordering cost
- Administrative costsare all the time and resources used to deal with the supplier. It includes the purchasing and invoicing costs.
- Transportation costsinclude all the costs invested in bringing orders to the warehouse or home.
- Inspection and Receivingare the optional but crucial components. Sellers hire the inspection experts to assess the inventory.
How to calculate ordering cost
The calculation formula for the order costs includes:
Administrative costs + logistical expenses + inspection costs / Annual number of orders
Sellers can efficiently calculate the total ordering costs annually and make their steps accurate toward the business deals.
Impact of ordering cost on EOQ
Do you have a high ordering cost?
Consider:
- High ordering costsincrease the EOQ. As a result, sellers have to make few orders but in bulk to reduce expenses.
- Low order costsallow the sellers to make multiple small orders without causing cost burdens.
Chapter 7. Practical Application of EOQ
A step-by-step guide to implementing EOQ
When it comes to the implementation, you have to consider the following steps.
- Step 1: Gather Data
First of all, get the data for demand (D), ordering costs (S), and holding costs (H). Remember to validate the current costs and ensure accuracy.
- Step 2: Calculate EOQ
Calculate the EOQ by adding the values in the EOQ formula.
EOQ= (2DS)/H
It helps determine the number of products to order and the time during which you should order.
- Step 3: Integrate EOQ into inventory
Integrate and apply the EOQ. For example, if the EOQ orders 50 orders to avoid the ordering costs, go for it. Similarly, you can understand our examples in detail.
- Step 4: Establish Reorder Points
Set time and threshold for the orders. Always ensure the orders are on time and triggered when a specific inventory level reaches.
EOQ calculation examples for different industries
Various industries have different calculation systems. Let’s apply our EOQ formula in multiple systems and understand how it works.
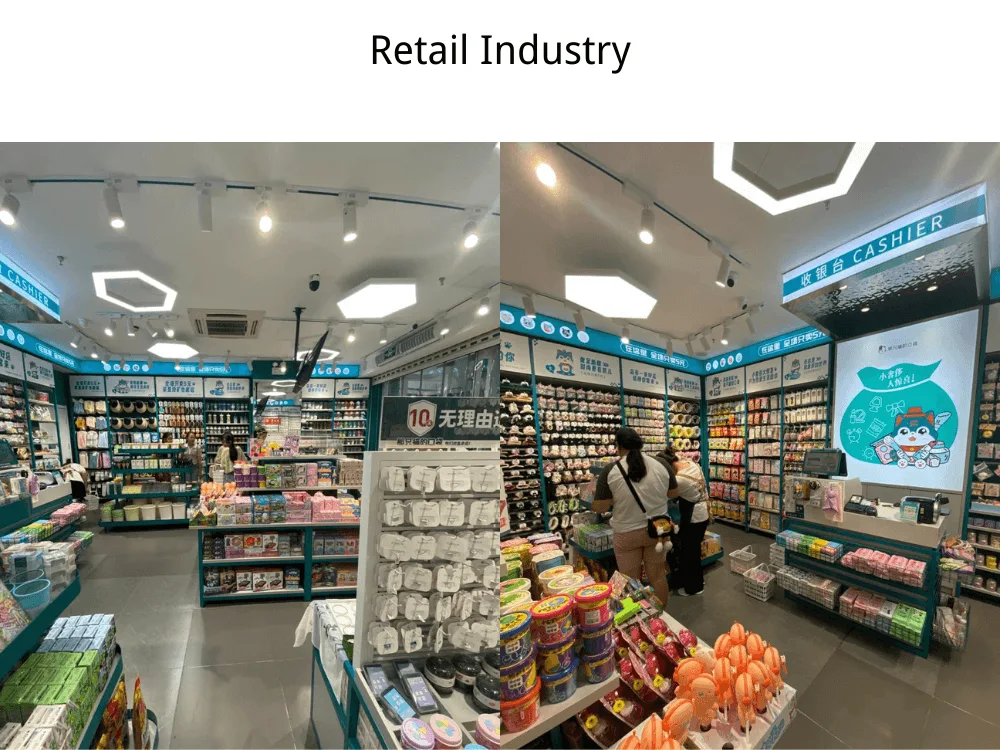
- Retail Industry
Consider a small retail store. Suppose it sells 500 products annually. Take an estimated holding costs. Suppose it costs $2 per annum while the ordering costs $30.
EOQ= (2∗500∗30)/2
EOQ= 15,000/2
EOQ= 7,500
Final EOQ ≈87 units
Retailers must order 87 units daily to reduce the ordering costs and optimize business.
- Manufacturing industry
Now, take the example of the manufacturing industry. A manufacturing plant orders 10K units annually.
Here is the data:
Ordering costs = $100 per order
Holding costs = $5 per year
EOQ=(2∗10,000∗100)/5
EOQ= 2,000,000/5
EOQ=400,000
Final EOQ= 632 units
The manufacturer has to order at least 632 units every time to avoid extra costs and optimize the products.
- eCommerce industry
The eCommerce industry has to come up with the EOQ for cost optimization. You can take the example of a retailer selling 2k products annually.
The data is:
Ordering costs = $50
Holding costs $1 per annum
EOQ= (2∗2,000∗50)/1
EOQ = 200,000
EOQ = 447 units
Retailers must order at least 447 units per order to optimize the business costs.
How to interpret EOQ results
With the calculation, EOQ helps define the total number of products per order. If there is:
- Higher EOQ. It means more products should be ordered each time. Why? It is because of cost optimization and competitive pricing.
- Lower EOQ. Reduced EOQ urges less number of orders to meet the demands.
Such an approach can define and optimize the products required to order each time.
Adjusting EOQ for real-world scenarios
EOQ is a practical guide, but sometimes, you must modify it to adjust it accordingly. Consider the adjustments in the following cases.
- Fluctuating demands
Demands don’t remain the same the whole year. You can order the products as per demand and adjust the EOQ.
- Variable lead times
Elevated lead times can urge EOQ to order more products. Adjust the EOQ as per the lead time variations.
- Volume discounts
Some sellers want volume discounts. They have to adjust the number of products ordered every time as per the EOQ values.
- Limited storage
In case of limited space, sellers adjust the number of orders. Instead of implementing the exact EOQ, they reduced the number of orders to occupy as much space as possible.
Chapter 8. EOQ vs. Other Inventory Models
Just-In-Time (JIT) inventory
JIT models ask for the product orders only when the products are needed. The purpose is to keep the inventory levels low and avoid the holding costs.
It is different from the EOQ as it orders only when products are needed. At the same time, the EOQ talks about the inventory assessment based on annual demands and orders.
Materials Requirements Planning (MRP)
The MRP model is more applicable in the manufacturing industry. It talks about ordering raw materials to produce inventory and minimize delays.
Difference include:
- MRP applies only to manufacturing, while EOQ applies to all industries.
- MRP talks about the current materials, not the annual ones, as in the EOQ.
Vendor Managed Inventory (VMI)
Vendor-managed inventory model integrates the warehouse with the suppliers. The ordering occurs when the products drop below a specific level. The supplier is responsible for the inventory levels, not the seller.
Differences include:
- VMI gives more control to the supplier and stocks left, not the seller, as in EOQ.
- EOQ is more straightforward in inventory management than the VMI.
- VMI deals when the products drop below a specific level, unlike the EOQ, which equally works for overstock and understock.
| Criteria | EOQ | Just-In-Time (JIT) | Materials Requirements Planning (MRP) | Vendor Managed Inventory (VMI) |
| Primary Goal | Optimize order quantity by balancing ordering and holding costs | Minimize inventory by receiving goods only when needed | Ensure material availability for production schedules | Shift inventory management responsibility to the vendor |
| Inventory Levels | Medium (balance between holding and ordering costs) | Very low (inventory received just in time for use) | Varies (inventory based on production needs) | Varies (vendor manages stock levels) |
| Demand Stability | Works best with stable and predictable demand | Works best with stable demand and reliable suppliers | Varies based on production forecasts | Varies, but vendor adjusts based on customer needs |
| Complexity | Simple calculation of optimal order quantity | High reliance on supply chain efficiency | High complexity, especially in manufacturing | Depends on vendor capabilities and relationship |
| Suitability for Manufacturing | Can be used for simple manufacturing processes | Ideal for lean manufacturing | Specifically designed for manufacturing | Less commonly used in manufacturing |
| Supplier Relationship | Moderate dependence on suppliers | High dependence on reliable suppliers | Varies, but often moderate reliance on suppliers | Strong vendor partnership required |
| Inventory Holding Costs | Balances holding and ordering costs | Very low holding costs | Varies depending on production requirements | Reduced for the customer (managed by vendor) |
| Stockout Risk | Low, if EOQ is calculated and followed properly | Higher risk if supply chain disruptions occur | Moderate, based on accuracy of production schedules | Low, as vendor monitors and restocks inventory |
| Ordering Frequency | Periodic orders based on EOQ calculations | Frequent, small orders as needed | Orders scheduled based on production needs | Automated ordering managed by vendor |
| Customization | Flexible, can be adjusted based on cost changes | Less flexible, highly dependent on supplier schedules | Can handle complex, multi-level production | Limited customization, relies on vendor’s system |
| Best For | Businesses with predictable demand and a need for cost optimization | Lean, efficient operations with reliable suppliers | Complex manufacturing with detailed production schedules | Businesses looking to outsource inventory management to suppliers |
When to use EOQ vs. other models
Each model has a specific case for deploying it under certain conditions. For example, EOQ is suitable when:
- Conditions are stable.
- You have accurate data for your sales with the current and past annual demands.
- Fluctuations are less.
- There are no limits on inventory management.
| Criteria | EOQ (Economic Order Quantity) | Just-In-Time (JIT) | Materials Requirements Planning (MRP) | Vendor Managed Inventory (VMI) |
| Business Type | Retail, wholesale, or manufacturing with stable demand | Lean manufacturing, assembly operations | Manufacturing with complex production processes | Retailers, distributors, or manufacturers with strong vendor relationships |
| Demand Stability | Predictable and stable demand | Stable, consistent demand | Fluctuating demand based on production schedules | Varies, vendor adjusts to demand fluctuations |
| Supply Chain Requirements | Moderate reliance on suppliers | Requires highly reliable, responsive suppliers | Requires integration with suppliers for raw materials | Requires a close partnership with vendors |
| Inventory Holding Costs | Balance between holding and ordering costs | Minimal inventory holding costs | Varies, inventory levels depend on production needs | Reduced for the business (managed by vendor) |
| Lead Time Flexibility | Moderate lead time | Short lead times, immediate delivery | Can accommodate longer lead times | Managed by the vendor, replenished as needed |
| Production Environment | Can be used for simpler manufacturing processes | Ideal for lean, low-inventory operations | Suitable for complex, multi-level production | Not typically used in production, but in distribution and retail |
| Supplier Relationship | Moderate reliance on suppliers | Requires tight coordination with suppliers | Moderate to high reliance on multiple suppliers | Strong, long-term relationship with the vendor |
| Cost Sensitivity | Used to optimize holding and ordering costs | Focus on reducing total costs through efficiency | Focus on minimizing stockouts and ensuring production flow | Costs are often managed by the vendor |
| Risk of Stockouts | Low if EOQ is followed | Higher risk due to dependency on supplier performance | Low to moderate, depending on forecast accuracy | Low, vendor is responsible for managing stockouts |
| Industry Examples | Retailers managing regular stock levels | Automotive, electronics, and other lean production sectors | Aerospace, automotive, electronics manufacturing | Retailers like supermarkets and pharmacies, and distributors |
Chapter 9. EOQ Model Variations
The EOQ model comes with multiple variations. Consider the following cases.
Production Quantity Model (EPQ)
The production quantity model refers to the inventory of in-house production. If the seller is a direct factory, this model is quite applicable. Instead of sudden replenishment, inventory replacement occurs gradually.
It is suitable for:
- Factories are selling products directly and maintaining the products.
- Manufacturers are looking to reduce production costs.
Quantity Discount Model
If the sellers want to grab the bulk discounts, they can use the quantity discount models. It tells whether bulk ordering is more beneficial or not.
It is suitable for:
- The sellers are looking for bulk orders with gradual inventory replacement.
- The sole purpose is to save costs.
Backorder Model
The backorder model is another EOQ variation that only applies in a few cases. Consumers are ready to wait when sellers no longer have the inventory in stock.
It is suitable in the following cases:
- Sellers offer customized products to meet consumers’ requirements.
- Consumers can wait for the products to grab and receive them at home.
Multi-Item EOQ Model
Multi-item EOQ model talks about a wide range of products. This model considers the warehousing facilities and the limited product space.
It is suitable for:
- Wholesalers and distributors are dealing with multiple products.
- Retailers sell a wide range of items in their retail stores.
Chapter 10. EOQ and Technology
EOQ calculators and software tools
Each tool has its significance in managing and calculating the orders.
The popular EOQ calculators include:
- TradeGecko
- NetSuite
- SAP Inventory Management
You can input the following values:
- Annual Demands
- Holding costs
- Ordering costs
These tools automatically verify and calculate the EOQ.
Using such tools can assist in the accuracy of orderings and proper management of the products.
Integrating EOQ into inventory management systems
- Inventory management tools
Various inventory management tools trace the number of products left. They can help calculate the prices. Some robust cloud-based inventory management tools include:
- Fishbowl
- Zoho Inventory
- Unleashed
- Integration of EOQ
Integration of EOQ can come with the following:
- Price tracking. Sellers can track the orders through these tools. They can understand the value of products and the number of products required to order.
- Automated order triggering. Keep the threshold of inventory. If you add 50 units as a threshold, the automated orders will be triggered when the product count is below 50.
- Inventory optimization. Overstocking or stockouts are not possible. EOQ integration allows the optimal number of warehouse products and effective cost management.
Advanced analytics and EOQ optimization
Analytics can devise new methods of success for the inventory. For example:
- Predictive analysis. AI integration can drive the data in real-time. It describes the previous year’s sales and the relevant conditions. Also, seasonal change prediction is possible. As a result, EOQ adjustment occurs, leading to better and optimized products.
- AI and Machine Learning magics. Integrating AI and machine learning can help you understand patterns and alert you to future demands. Sellers will readjust the EOQ. Consider the past performances and overstocking or stockouts. Order new products from suppliers. Get sales and demands based on the requirements.
- Optimization algorithms. Specific algorithms can trace the changes and decide better. They keep an eye on demand variability, lead time uncertainty, and fluctuating costs.
Chapter 11: FAQs
-
Does EOQ differ from other inventory management models?
EOQ is quite different from the other management models such as Just in time inventory or ABC model. For example, the EOQ urges the sellers to balance their products. However, different methods, such as Just in Time, only urge the minimization of the number of products and the keeping of crucial items. Therefore, EOQ stays at a better end than the other models.
-
Is EOQ valid for all types of products?
EOQ is quite good at the green products that sell the whole year. It helps forecast and order the required number of items. However, this method might fail if the inventory fluctuations and demands are mind-boggling. So, the EOQ model can be applied to stable and non-perishable products.
-
What happens if the actual demand is different from the forecasted demand?
If the actual demand is higher than the forecasted, prepare for stockouts. Overstocking occurs if the actual market is less while the forecast is higher. As a forecaster, you must consider all these costs.
-
How frequently should you recalculate the EOQ?
Set a time period for the calculation of the EOQ. Usually, a monthly or annual forecast period is a good idea. However, consider the current demands, holding costs, and ordering costs. All the factors influence the EOQ.
Conclusion
EOQ calculation can be super straightforward, but the problem is when you don’t have a plan to order. Ordering high quantities can cause a problem with overstocking and increased costs.
However, you can connect with sourcing companies such as JustChinaIt and have your inventory refilled. We can alert you about the deceased number of products or overstocking as a one-stop solution. Fetch the following services from our experts.
- Sourceproducts at wholesale prices.
- Warehousethem and keep their stocks optimal.
- Consolidate
- Shipthem to your destination location.
Talk to our experts for the best.

